MLB teams are gearing up for another grueling season — not just on the field, but on the road and in the air.
Travel distance plays a major role in team fatigue, recovery, and even game-day performance. Between the MLB’s World Tour in Tokyo, and temporary new stadiums for the Athletics and Tampa Bay Rays, some teams are set to face tougher travel schedules this year that could impact their season.
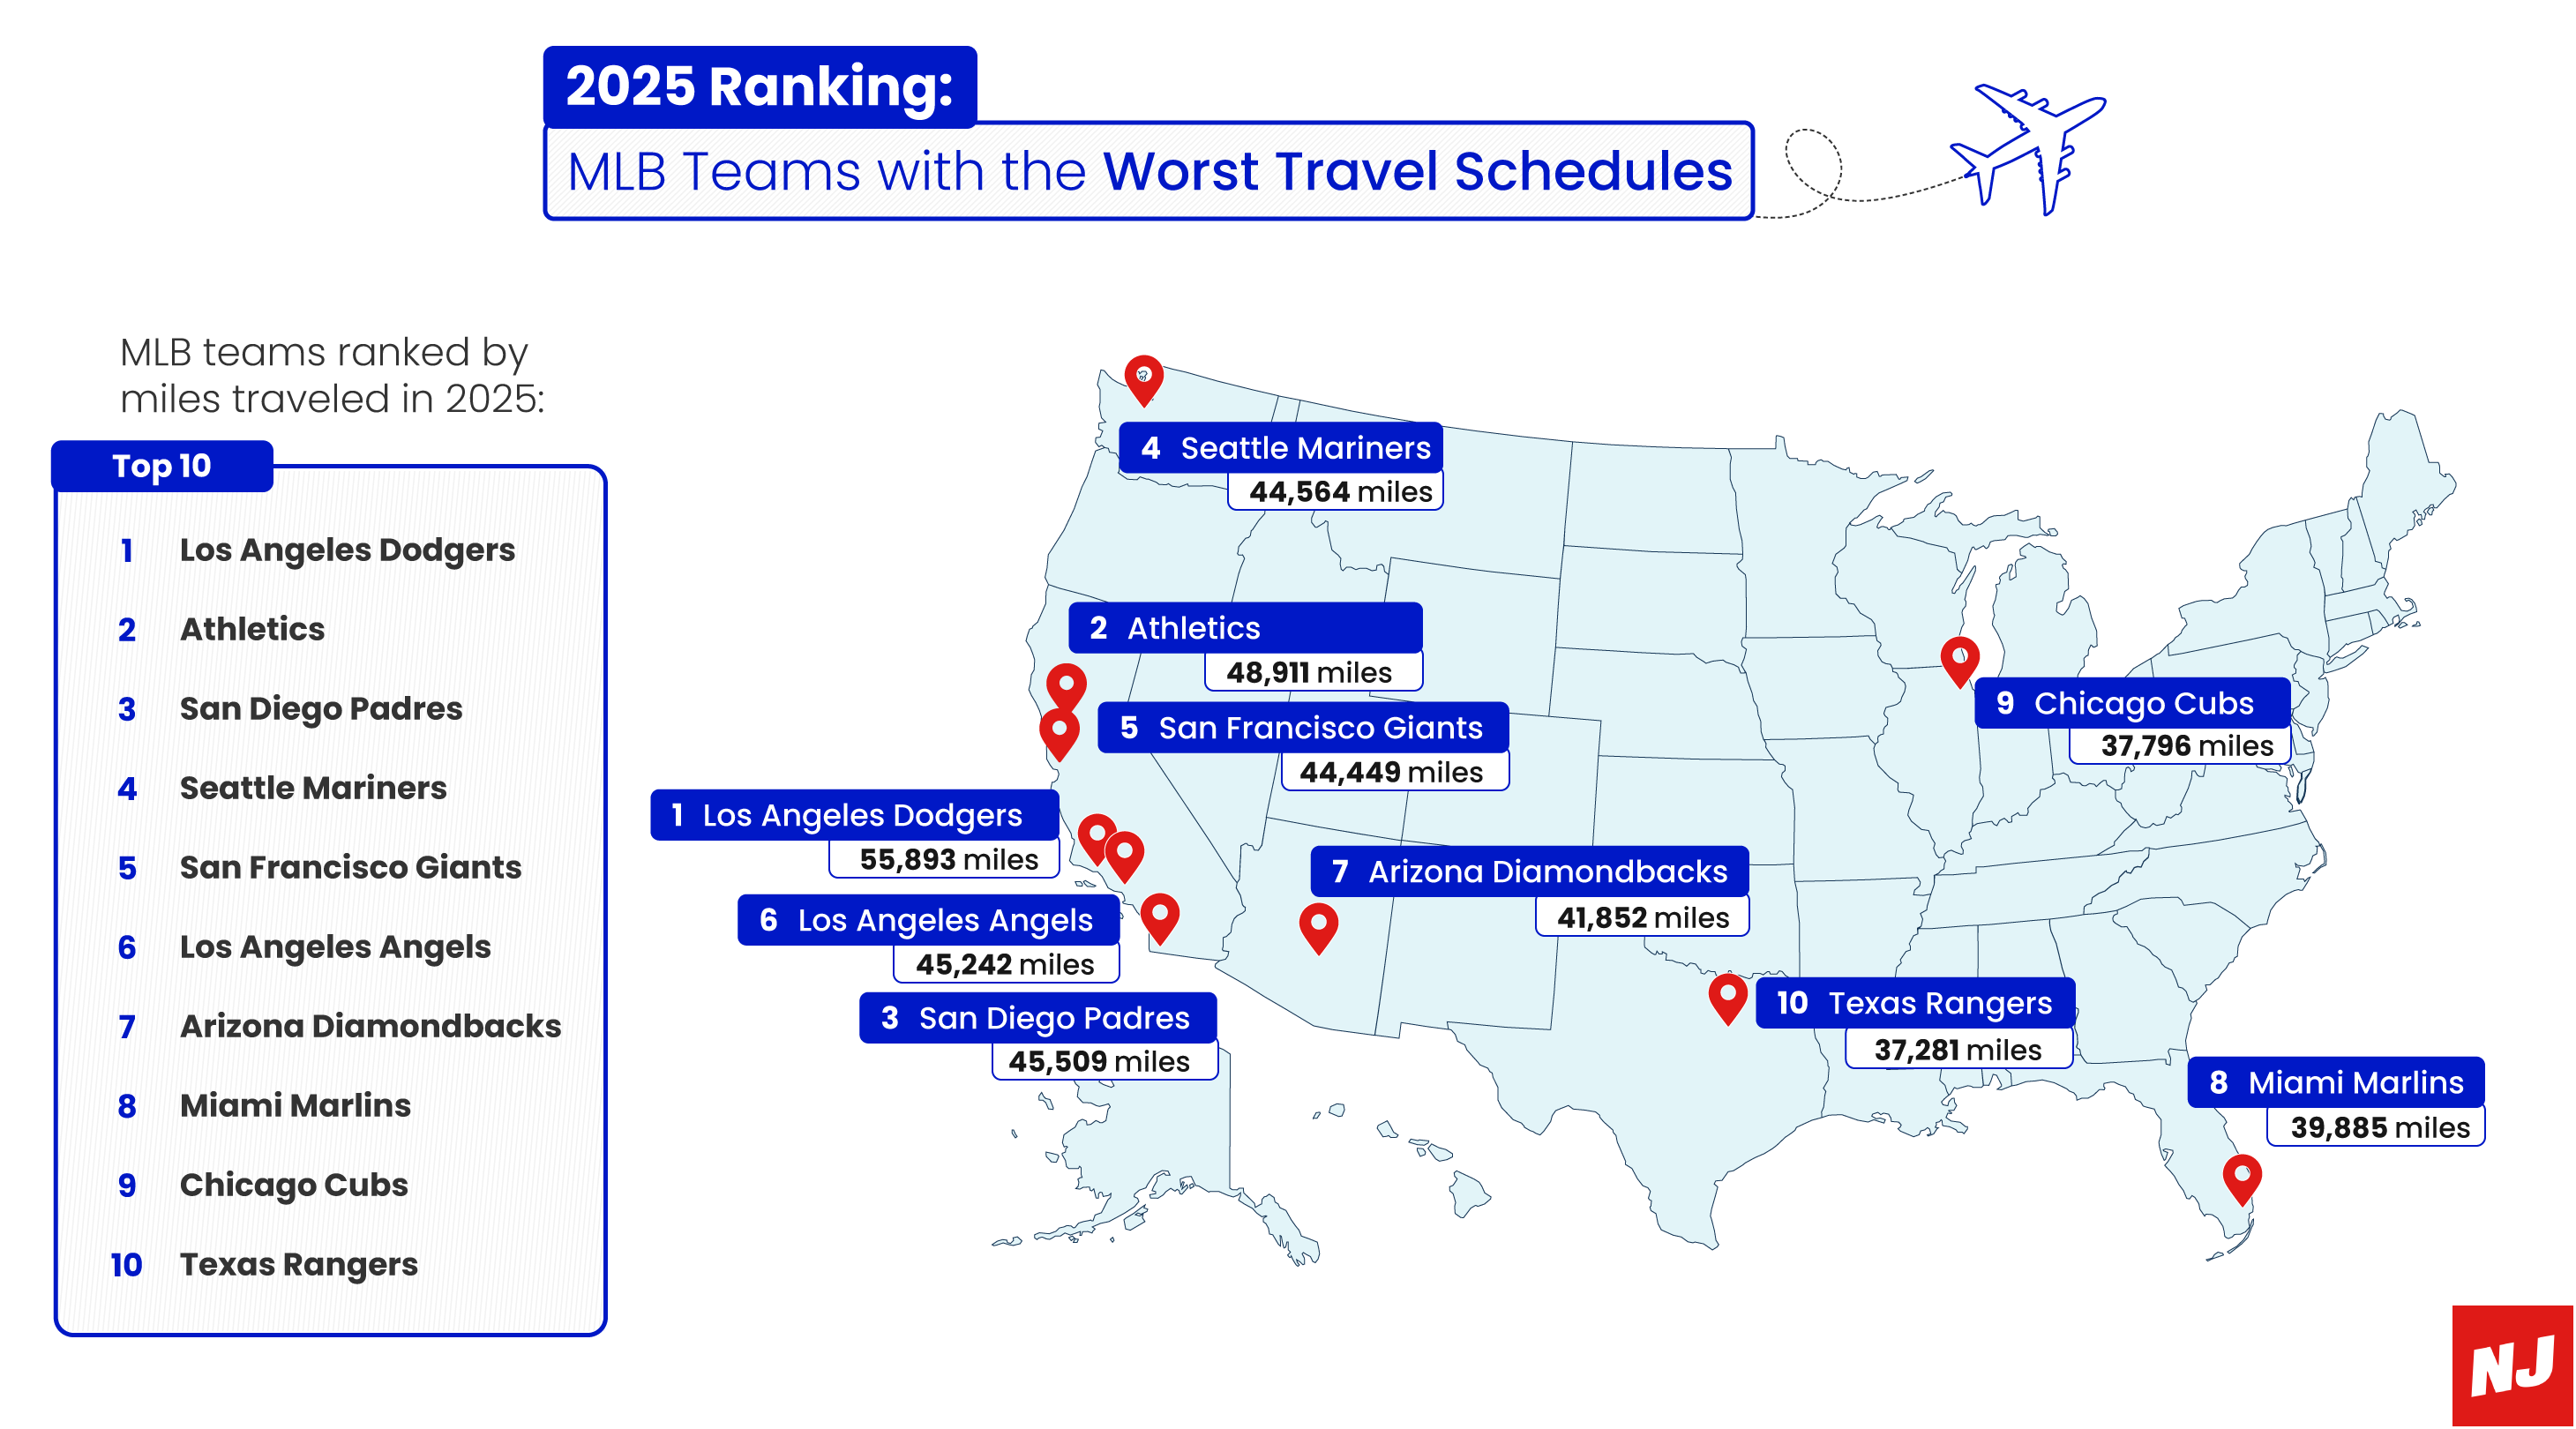
Which MLB Teams Will Travel the Most in 2025?
NJ.bet, an online casino and sports betting guide, analyzed every MLB team’s 2025 regular-season schedule to determine which teams will travel the most and least miles this season, how far each team travels on an average per road trip, and how the travel miles compare to last season.
Using precise stadium-to-stadium distance calculations, our analysis reveals the true impact of travel on MLB teams.
Highlights:
- West Coast teams dominate travel rankings, with Los Angeles Dodgers, the Athletics, San Diego Padres, Seattle Mariners, and San Francisco Giants all leading the league in total travel miles.
- Tokyo Games: The Los Angeles Dodgers and Chicago Cubs will open the 2025 MLB season in Tokyo, adding over 10,000 miles roundtrip to their travel totals.
- The Cleveland Guardians will travel the least in 2025, covering just 25,488 miles.
- League Average: MLB teams will travel an average of 35,488 miles this season, slightly up from last year’s 34,727 miles.
- Biggest Increase: Aside from the Dodgers and the Cubs, the Athletics will travel 3,870 more miles than they did in 2024.
- Biggest Decrease: The Detroit Tigers caught a break this season, traveling 4,602 fewer miles than in 2024.
- Road Trip Fatigue: The Seattle Mariners have the longest average road trip miles in the league at 4,051 miles per trip, while the Athletics are close behind with 3,762 miles per trip.
Over the course of the 162-game season, MLB teams collectively travel hundreds of thousands of miles crisscrossing the country. But some teams will be putting in significantly more mileage than others.
Two teams, in particular, will rack up considerable miles this season: the Los Angeles Dodgers and Chicago Cubs, who will face off at the Tokyo Dome as part of MLB’s 2025 Opening Series.
According to our analysis, the Los Angeles Dodgers will travel the most in 2025, covering a staggering 55,893 miles throughout the season. This includes their trip to Tokyo, which adds approximately 10,947 extra miles to their schedule.
In terms of the lightest travel schedules, the Cleveland Guardians will travel the least, logging just 25,488 miles in 2025. With a centralized location in the Midwest, the Guardians benefit from relatively short trips to division rivals.
Perhaps unsurprisingly, teams in the West, South, and Southeast will log more travel miles than teams in the Midwest and Northeast, largely due to geographic spacing between division rivals.
Explore the full rankings below to see how far each team will travel this season:
MLB Teams Ranked by Miles Traveled in 2025
#1. Los Angeles Dodgers
Total miles traveled in the 2025 regular season: 55,893
Average miles per road trip: 3,726
#2. The Athletics
Total miles traveled in the 2025 regular season: 48,911
Average miles per road trip: 3,762
#3. San Diego Padres
Total miles traveled in the 2025 regular season: 45,509
Average miles per road trip: 3,501
#4. Seattle Mariners
Total miles traveled in the 2025 regular season: 44,564
Average miles per road trip: 4,051
#5. San Francisco Giants
Total miles traveled in the 2025 regular season: 44,449
Average miles per road trip: 3,704
#6. Los Angeles Angels
Total miles traveled in the 2025 regular season: 43,265
Average miles per road trip: 3,605
#7. Arizona Diamondbacks
Total miles traveled in the 2025 regular season: 41,852
Average miles per road trip: 3,219
#8. Miami Marlins
Total miles traveled in the 2025 regular season: 39,885
Average miles per road trip: 3,324
#9. Chicago Cubs
Total miles traveled in the 2025 regular season: 37,796
Average miles per road trip: 2,520
#10. Texas Rangers
Total miles traveled in the 2025 regular season: 37,281
Average miles per road trip: 2,947
Average Road Trip Miles Per MLB Team
Not all travel schedules are created equal.
While total miles give an overall sense of potential travel fatigue, average road trip miles provide a more detailed look at how far teams are traveling per trip. Longer road trips can lead to greater fatigue and more time away from home.
For the 2025 season, the Seattle Mariners have the longest average road trip, covering an average of 4,051 miles per trip. Meanwhile, the Chicago White Sox have the shortest schedule in terms of road trips, covering an average of 1,877 miles while on the road.
Which MLB Teams Will Travel More in 2025?
How does this year’s schedule compare to last year’s?
Several teams are facing heavier travel schedules in 2025, including the Los Angeles Dodgers with 12,741 extra miles, Chicago Cubs (+9,789 miles), the Athletics (+3,870 miles), and the Washington Nationals (+3,552 miles).
With the Athletics temporarily relocating to Sacramento for the 2025 season, their travel footprint has shifted, making their road schedule slightly different from previous years. Similarly, the Tampa Bay Rays will play home games in Tampa instead of St. Petersburg due to Tropicana Field renovations, which will also result in slight adjustments to their total travel miles this season.
On the flip side, the Detroit Tigers will travel 4,602 fewer miles this season, giving them a potential advantage in terms of travel fatigue.
As teams prepare for the 2025 season, travel logistics will play a crucial role in performance, rest, and even playoff positioning.
Fans will certainly be following all the action along the way. Whether you’re planning to catch your team playing at home or on the road, NJ.bet’s sports betting bonus guide offers everything you need for the ultimate gameday experience.
Methodology
To determine how far each MLB team will travel during the 2025 regular season, we calculated the total linear miles traveled between ballparks using the official MLB 2025 schedule. We measured the direct distance (linear miles) between each stadium for every road game on a team’s schedule, summing these distances to determine each team’s total travel miles for the season. We also identified each individual road trip (defined as a consecutive stretch of away games before returning home) and calculated the average miles traveled per trip for every team.
Additionally, we compared 2025 travel miles to 2024 data to highlight which teams will travel more or less than last season.
Special travel considerations: Our analysis accounted for unique travel adjustments in 2025, including: The Dodgers and Cubs’ Tokyo Series, which significantly increased their total miles.
The Oakland A’s temporary move to Sacramento, shifting their home-to-road travel patterns as well as the Tampa Bay Rays’ relocation to George M. Steinbrenner Field in Tampa, which affected their travel calculations.
All calculations are based on direct (as-the-crow-flies) distances between stadiums and do not factor in specific flight paths, travel delays, or team-determined routing.
Sources: MLB, National Oceanic and Atmospheric Administration
Fair Use: When using this data and research, please attribute by linking to this study and citing https://nj.bet
If you’re interested in learning more about betting, read how to read odds and which promo codes you can use to claim your welcome offers.